Creating Graphs & Charts
Charts are various representations created from a large set of information. Charts can include graphs, diagrams, or be in the form of tables of data. The term Graph generally means a specific type of chart that shows the mathematical relationship between varied sets of data. A Graph is a type of subgroup of a Chart. A Chart can take the form of a Graph, a table, or some other diagram or picture or visualization form.
Proportion & Scale
Proportion and scale are important concepts in math that involve the relationship between different quantities and their relative sizes. Proportion refers to the relative size of different parts of a whole, while scale refers to the size of an object or image in relation to its surroundings. These concepts are important in a wide range of fields, including art, architecture, and engineering.
Computational Geometry
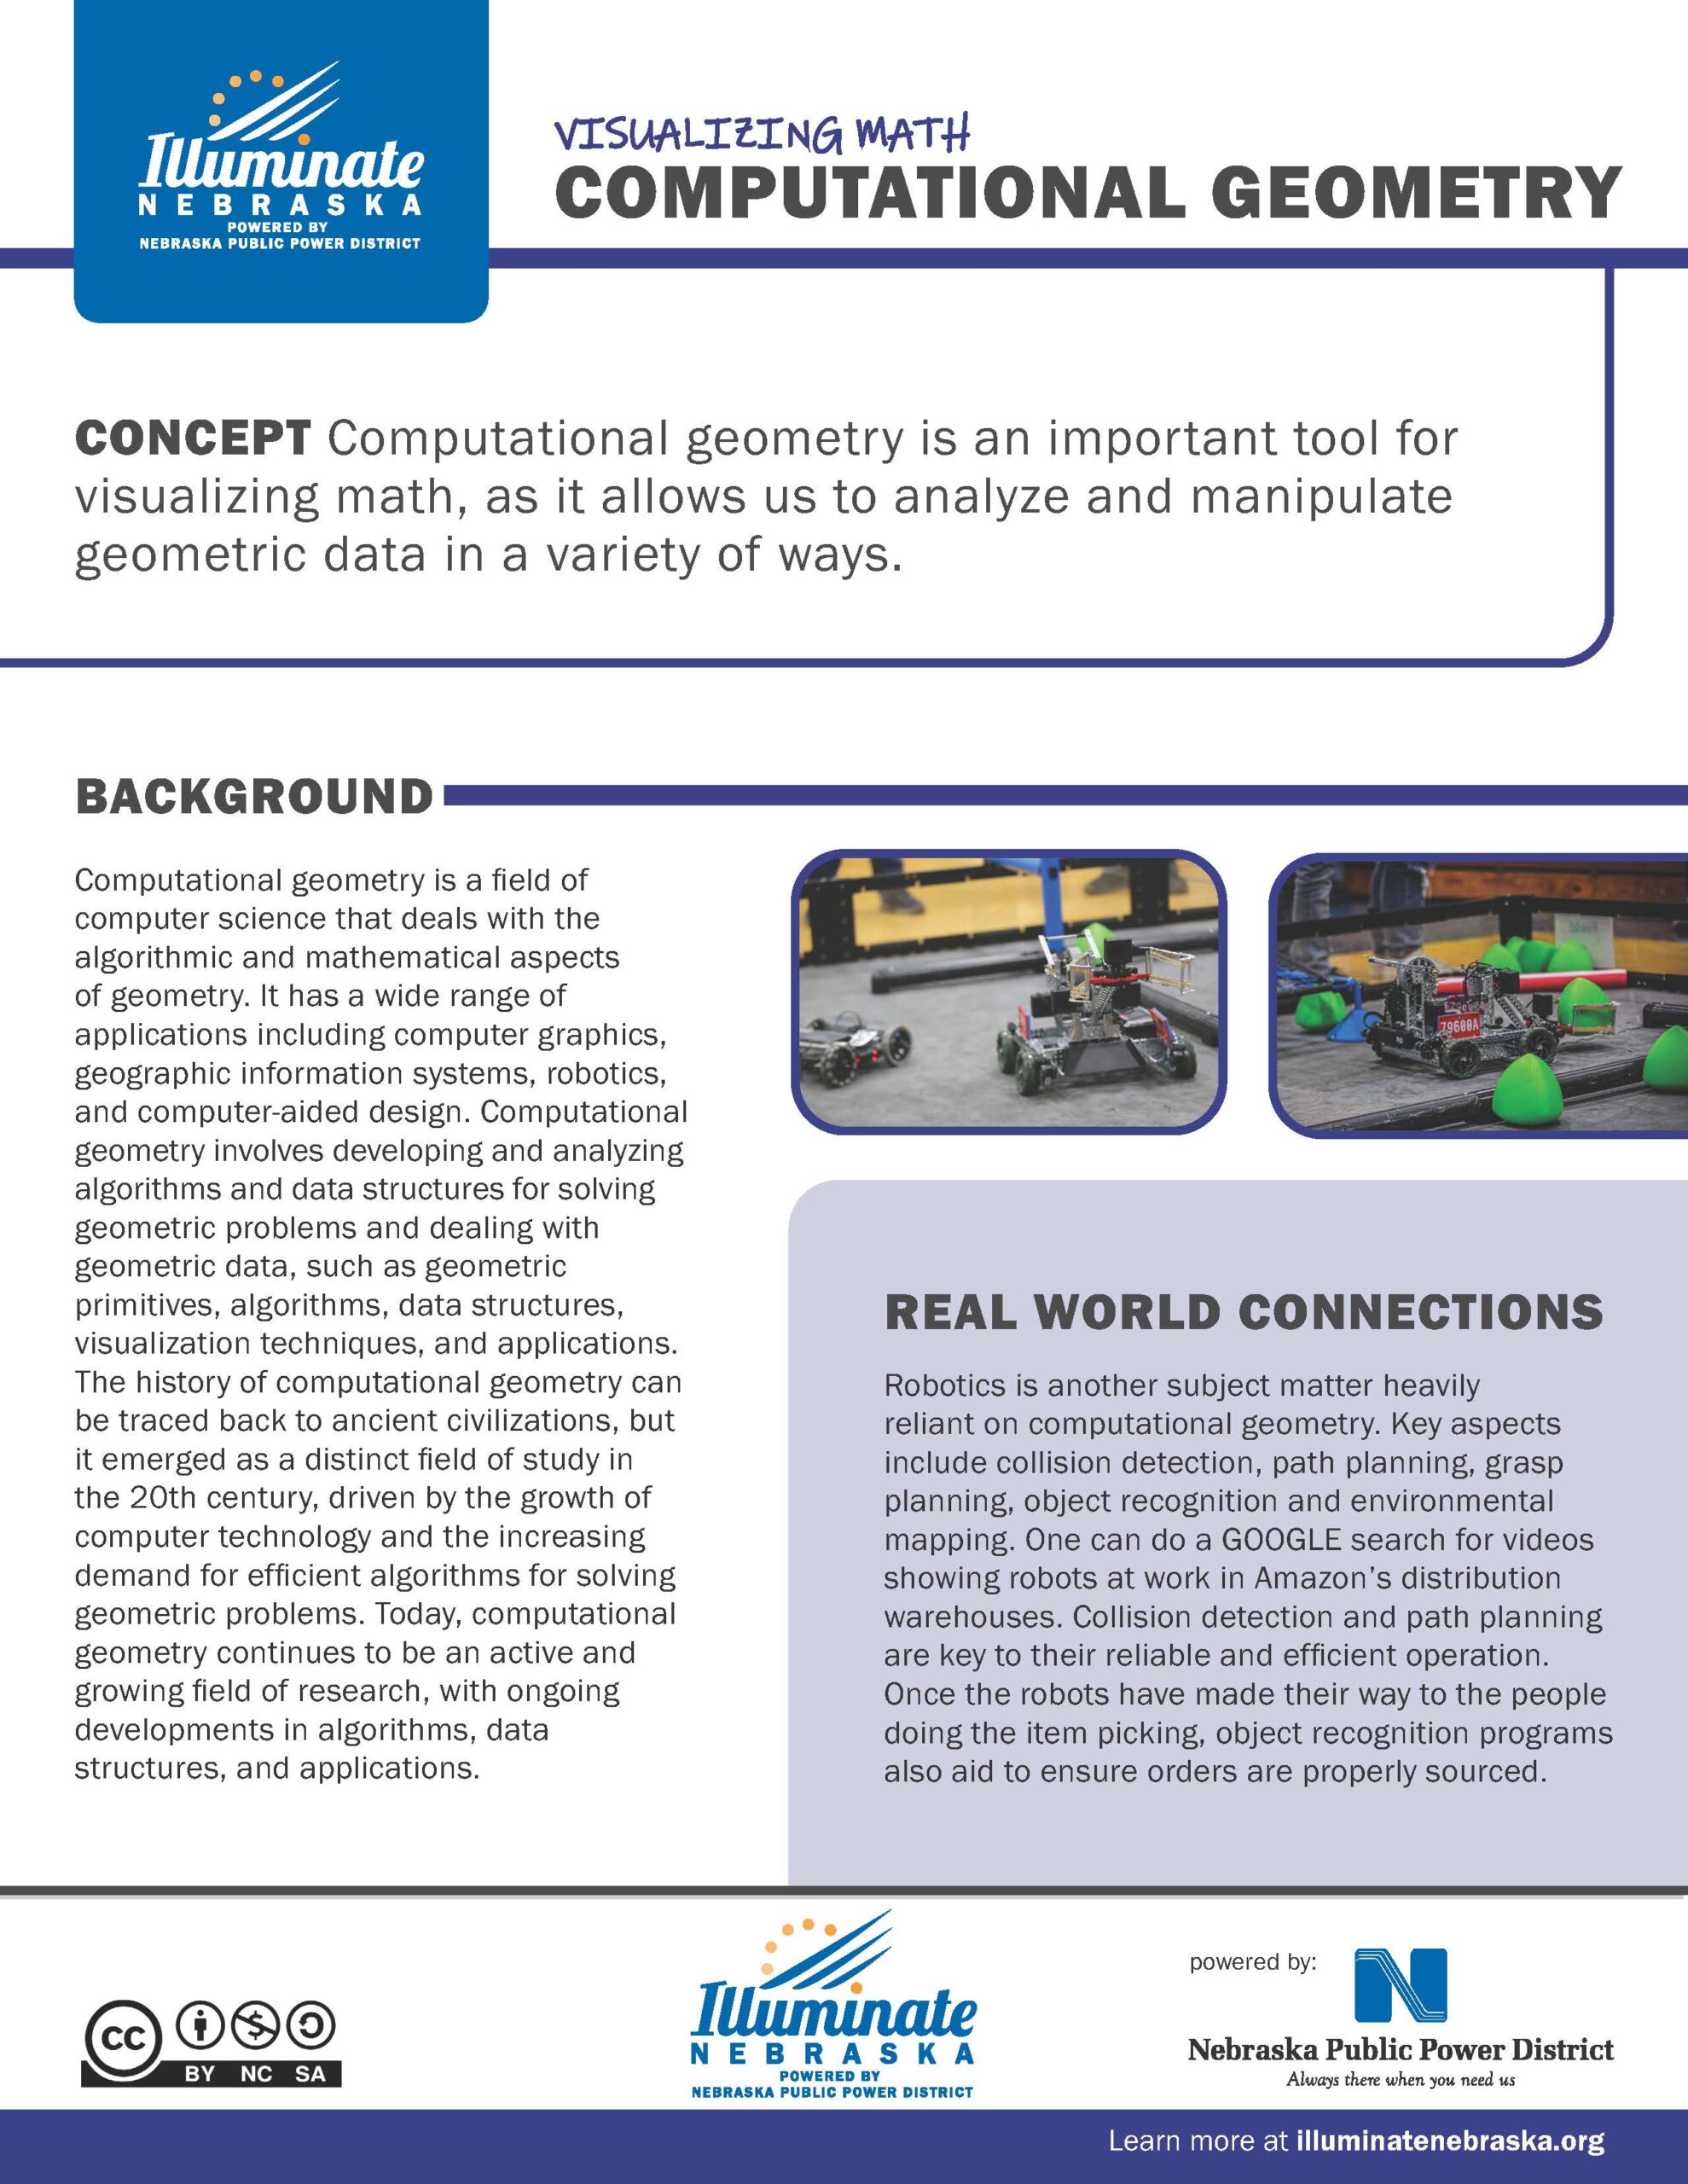
Computational geometry is an important tool for visualizing math, as it allows us to analyze and manipulate geometric data in a variety of ways.
Fractals
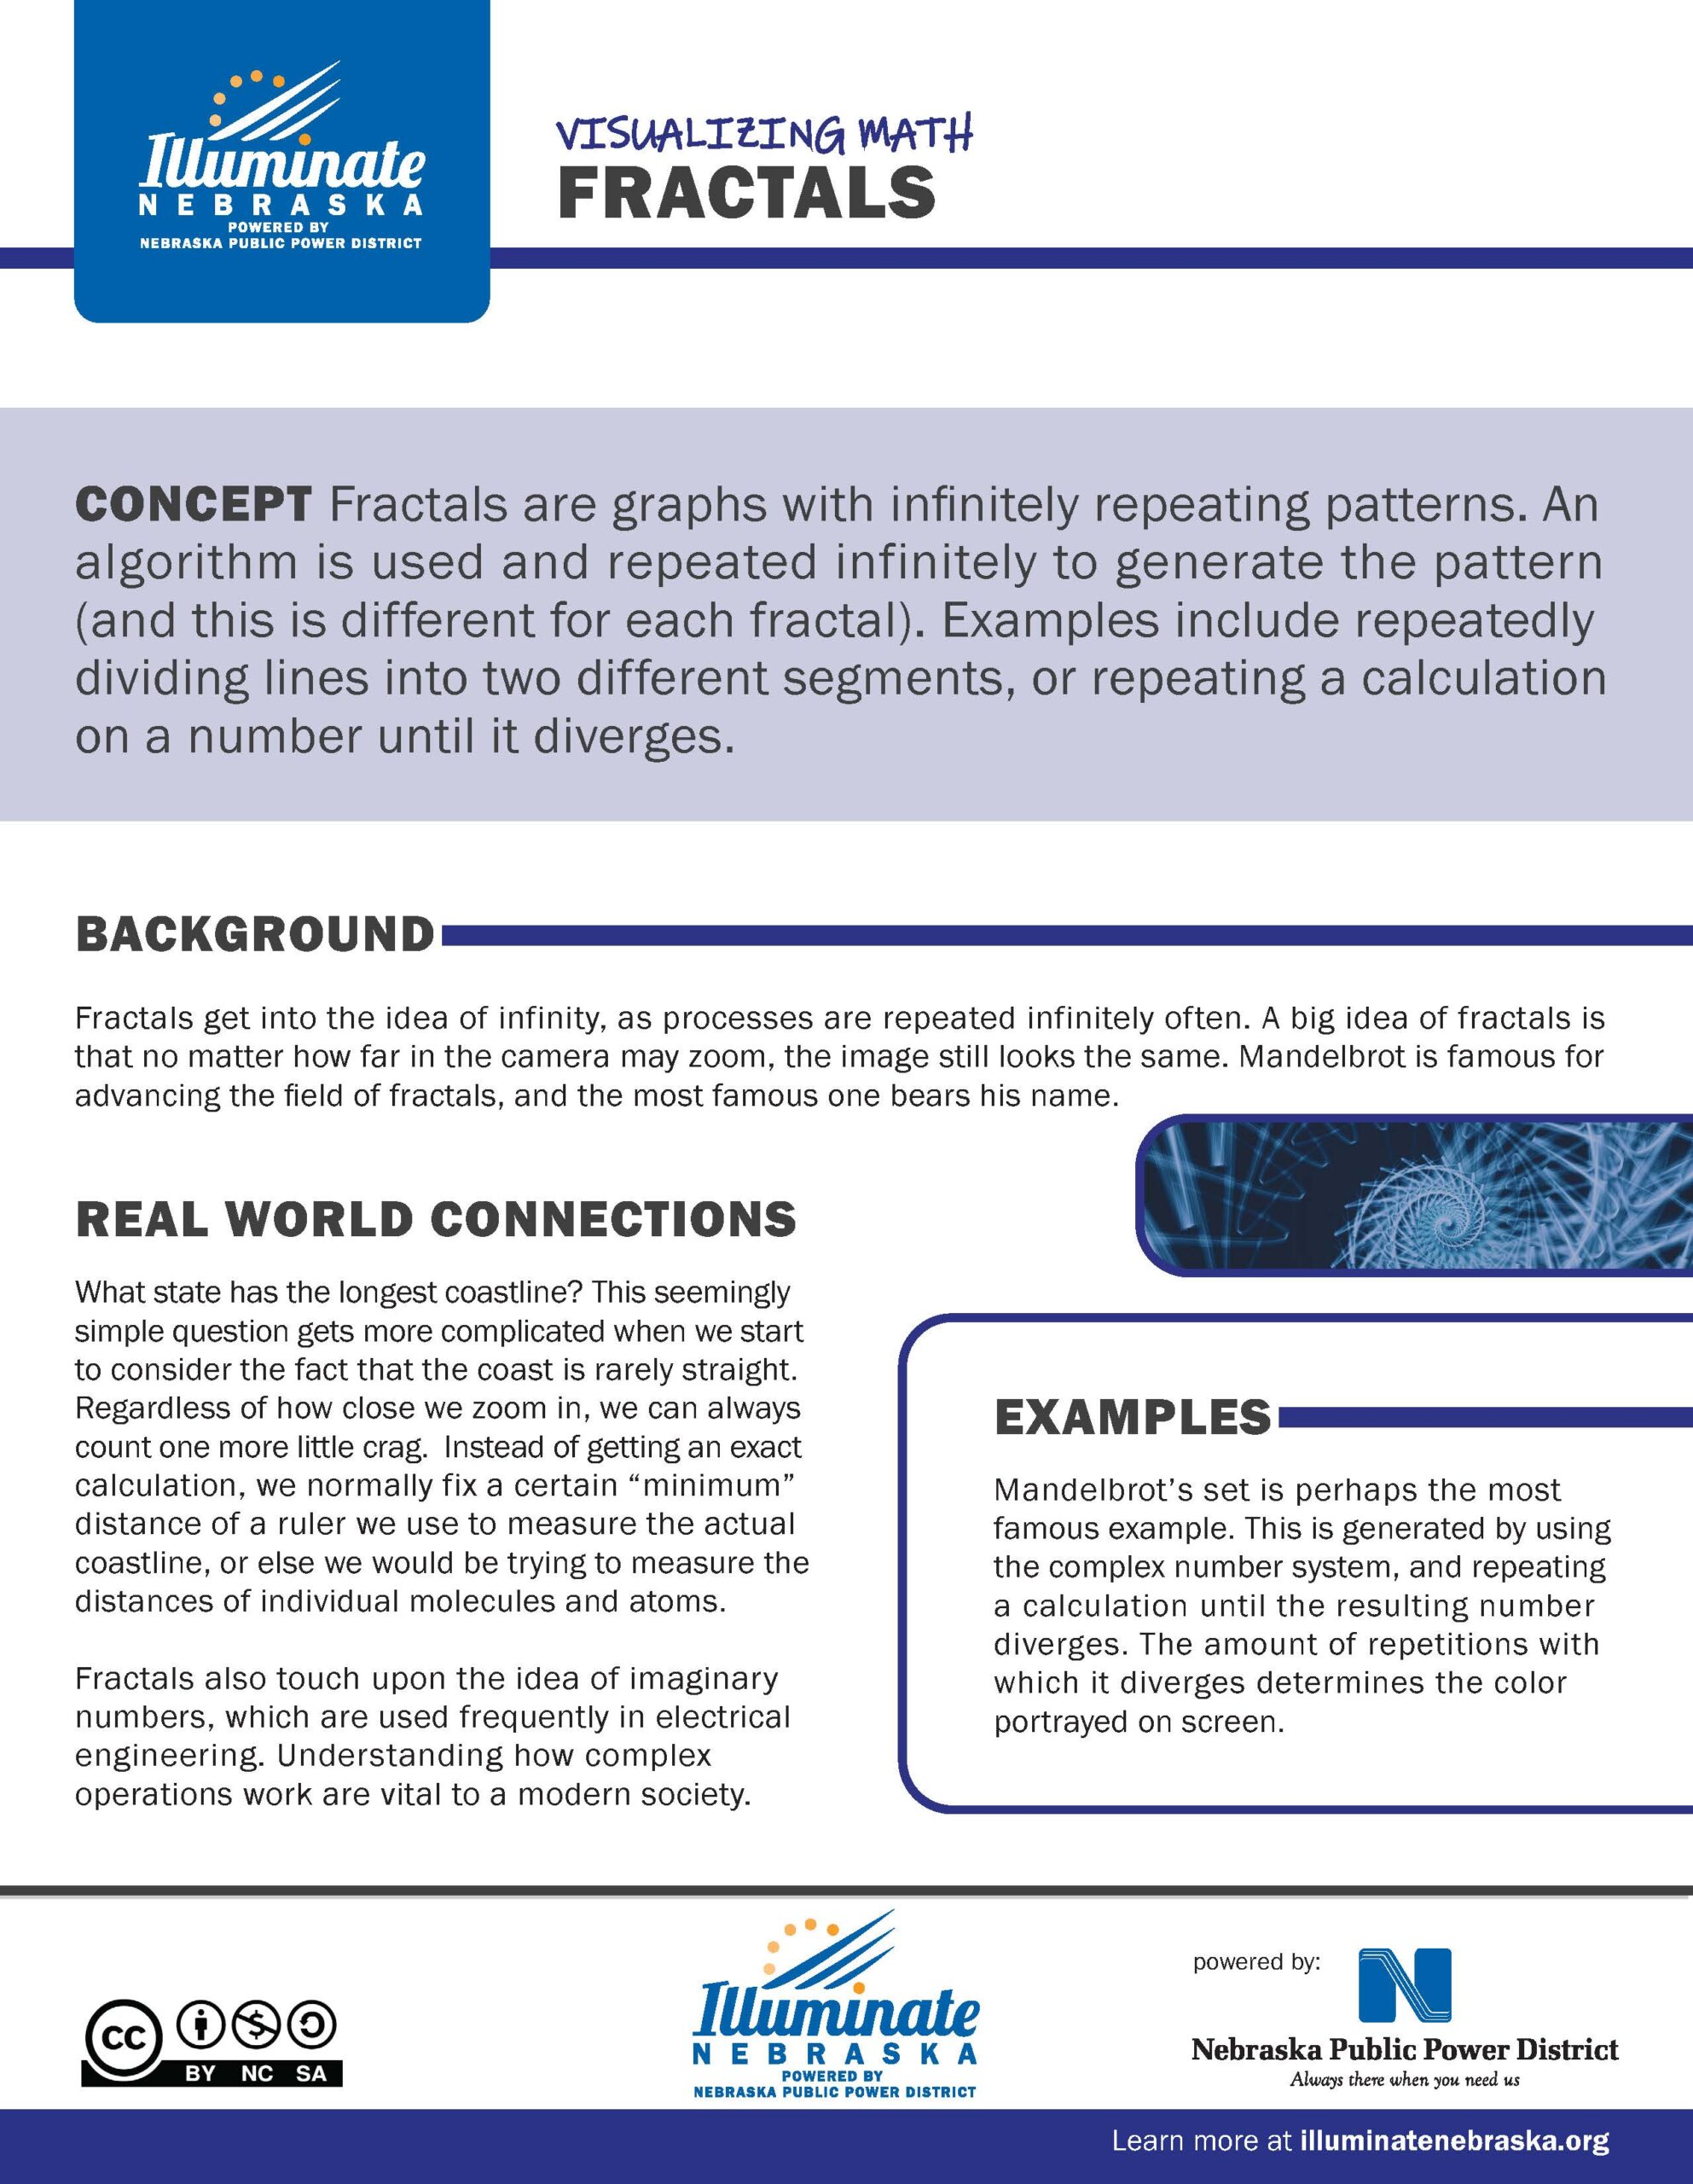
Fractals are graphs with infinitely repeating patterns. An algorithm is used and repeated infinitely to generate the pattern (and this is different for each fractal). Examples include repeatedly dividing lines into two different segments or repeating a calculation on a number until it diverges.
Seeing Math in Our World
Math is very useful in everyday life. It allows us to apply problem-solving, critical thinking, and reasoning skills.